
SHANGHAI MICROCRE OPTICS-MECH TECH CO., LTDAbout MICROCRE400-812-7833
MICROCRE · RESEARCH SCIENCE

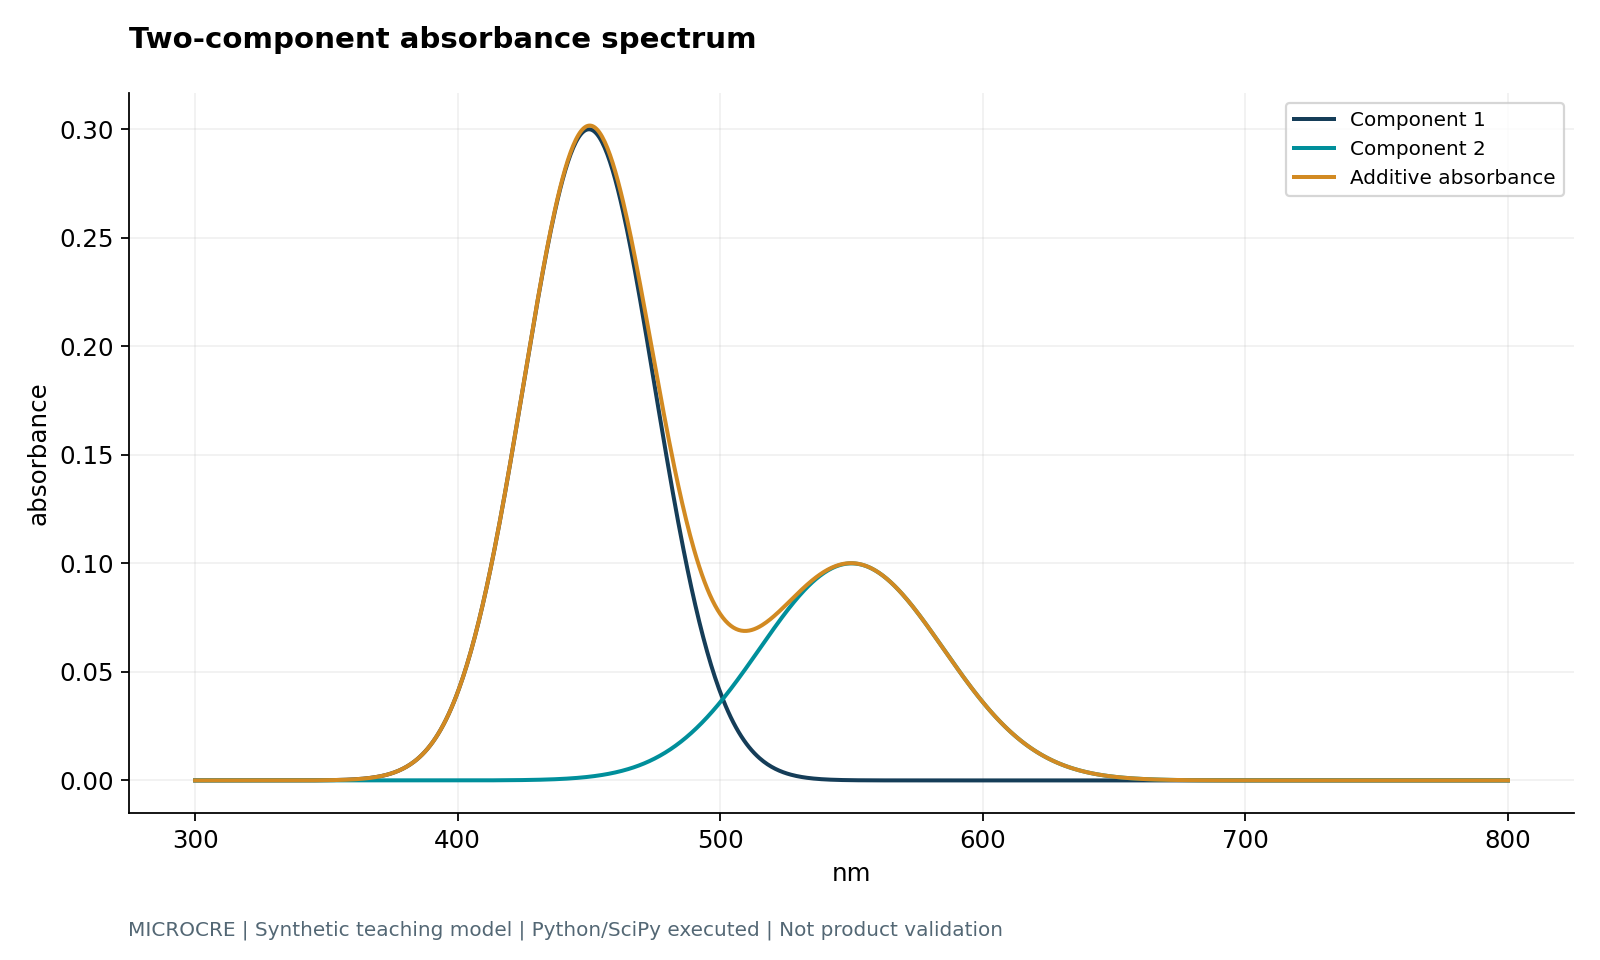
Two-component absorbance spectrum
An educational model is not an instrument measurement. Check units, assumptions and scope.

Two-component absorbance spectrum
Python plot for default inputs; the interactive plot uses current inputs.

Translation pending review.

Description

在Beer–Lambert关系下合成两个具有高斯摩尔吸光系数谱带的组分。谱带形状和峰值为假设值,用于观察浓度、光程与谱带重叠。

Equation

A(λ)=lΣc_i ε_i(λ);ε₁,max=15000、ε₂,max=10000 L/(mol·cm);T=10⁻ᴬ

Input parameters

  • key

    concentration1

    label

    组分1浓度

    Unit

    µmol/L

    Value

    20

    min

    0

    max

    1000

    step

    any

  • key

    concentration2

    label

    组分2浓度

    Unit

    µmol/L

    Value

    10

    min

    0

    max

    1000

    step

    any

  • key

    path

    label

    光程

    Unit

    cm

    Value

    1

    min

    0.001

    max

    10

    step

    any

  • key

    center1

    label

    谱带1中心

    Unit

    nm

    Value

    450

    min

    350

    max

    700

    step

    any

  • key

    center2

    label

    谱带2中心

    Unit

    nm

    Value

    550

    min

    350

    max

    700

    step

    any

Outputs

  • key

    peak_absorbance

    label

    合成峰吸光度

    Unit

    1

  • key

    peak_wavelength

    label

    采样峰位置

    Unit

    nm

  • key

    minimum_transmittance

    label

    最小透射率

    Unit

    1

Assumptions and limits

  • 稀溶液、均匀光程、组分独立吸收;谱带标准差固定25/35 nm。

  • 300—800 nm以0.5 nm采样;浓度从µmol/L乘10⁻⁶。

Limitations

  • 无散射、杂散光、化学平衡、仪器带宽与饱和效应。

  • 不是真实化合物谱库,也不构成浓度定量校准。

Model method

假设摩尔吸光谱与线性吸收定律的数值采样。

Validation

校验零浓度零吸收、浓度/光程线性、0≤T≤1。

Execution and reproduction

python

已实际运行,详见验证报告

matlab

提供可复现源码;当前环境无MATLAB/Octave,未执行

Related instruments, methods and research

Your next research question. Let’s explore.

Tell us about your material, specimen and measurement goal.

Discuss your application ↗
Find your instrument
⌕
Search products, cases, solutions, standards and literature.